How Many Hits Does My Website Get?

You may have spent £1,000s or £10,000s on your website. It looks great. No. It looks fantastic! But what next? Do you know how many hits it gets?
Do you know how many people visit your website or how much traffic it’s getting? Are the results better or worse than before the revamp? Has your email campaign been successful? Are the phones now ringing off the hook? Perhaps they are but maybe they’re not. Do you know how visitors found out about you? Did they find you from a Google search, meet you at a trade show or see an Instagram ad? Did you place an ad in the local press? Do you know and does it matter?
It matters because you’ll want the best return on your marketing investment. If you’re employing a Marketing Manager to write weekly content with the intention it will generate traffic from Google … well, does it? If you’re employing an agency to generate clicks from Meta ads (Facebook, Instagram, WhatsApp), again does it? If you sent out a Christmas email newsletter with offers and promotions, did anyone take up the offer? Was it time and money well spent?
The easiest and most popular way to find out how many visitors your website gets and what people actually do when they are on your site is via a free platform called Google Analytics. You’ll likely have heard of it but might not be sure what it is or actually does. It’s worth its weight in gold for any business owner or marketing team.
What is Google Analytics?
Google Analytics is a free web-based tool that helps you understand how your website performs. There is nothing to download (though there is also a mobile app). It is entirely web-based and measures performance in different ways, telling you:
- How many hits (visitors) you got over a selected time period
- How they arrived at your site (from Google, social media, paid ads, emails etc)
- If visitors are new or returning
- Which pages people viewed
- The most visited pages
- How long they spent on your site
- If they made a purchase or downloaded content such as a How To guide, instruction manual or sales brochure
- What type of device they used: desktop, mobile or tablet
- In which country and/or city they’re located
… and much more.
The current version of Google Analytics is called Google Analytics 4 or GA4 for short. The previous version was called Universal Analytics (UA) and is now redundant.
For the purpose of this article we’re assuming Google Analytics has already been set up and installed on your website. If you need help setting up Google Analytics, please let us know. Below is a quick guide on how you can find out basic statistics on how people arrive at and use your site.
Google Analytics Acquisition
How do people arrive at your site?
How do people arrive at your website? Where do they come from?
Depending on how GA4 has been set up go to either one of:
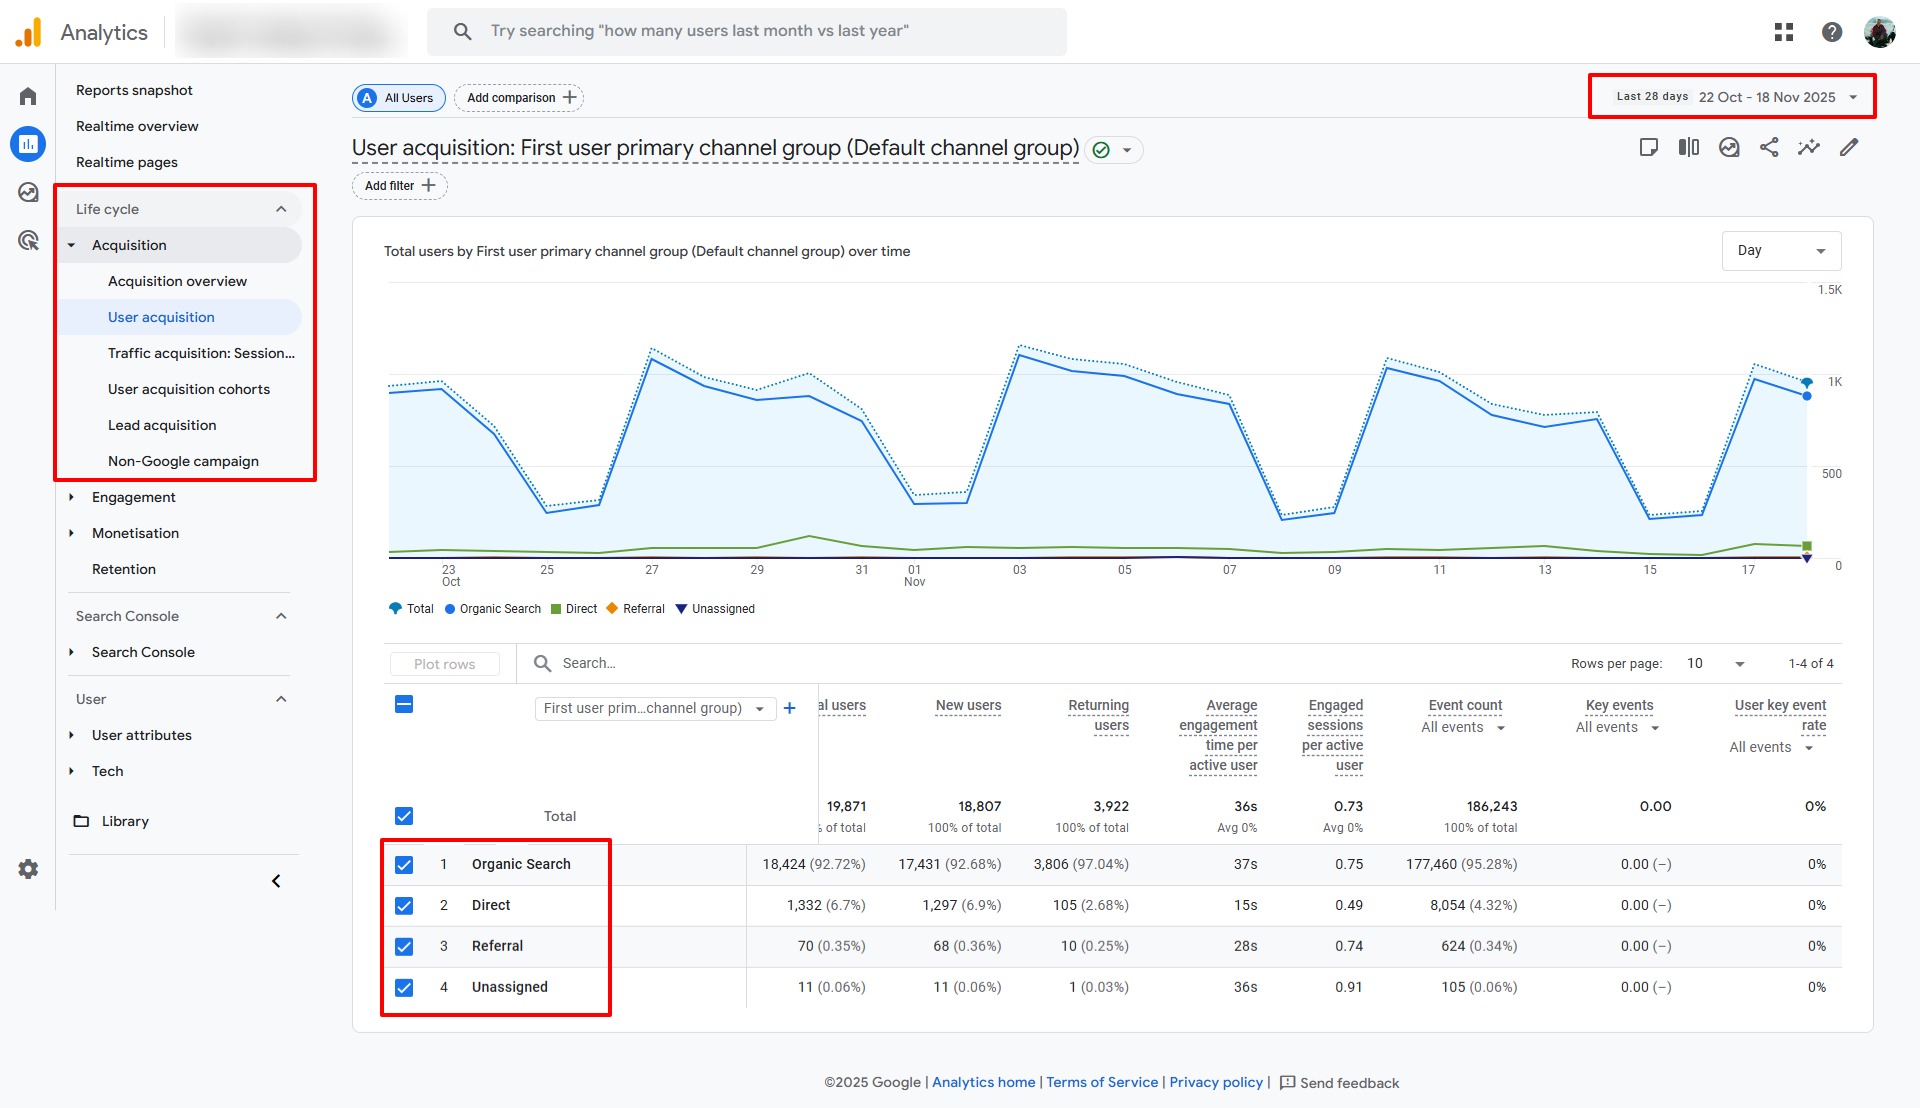
- Life cycle > Acquisition > User acquisition, fig. 1
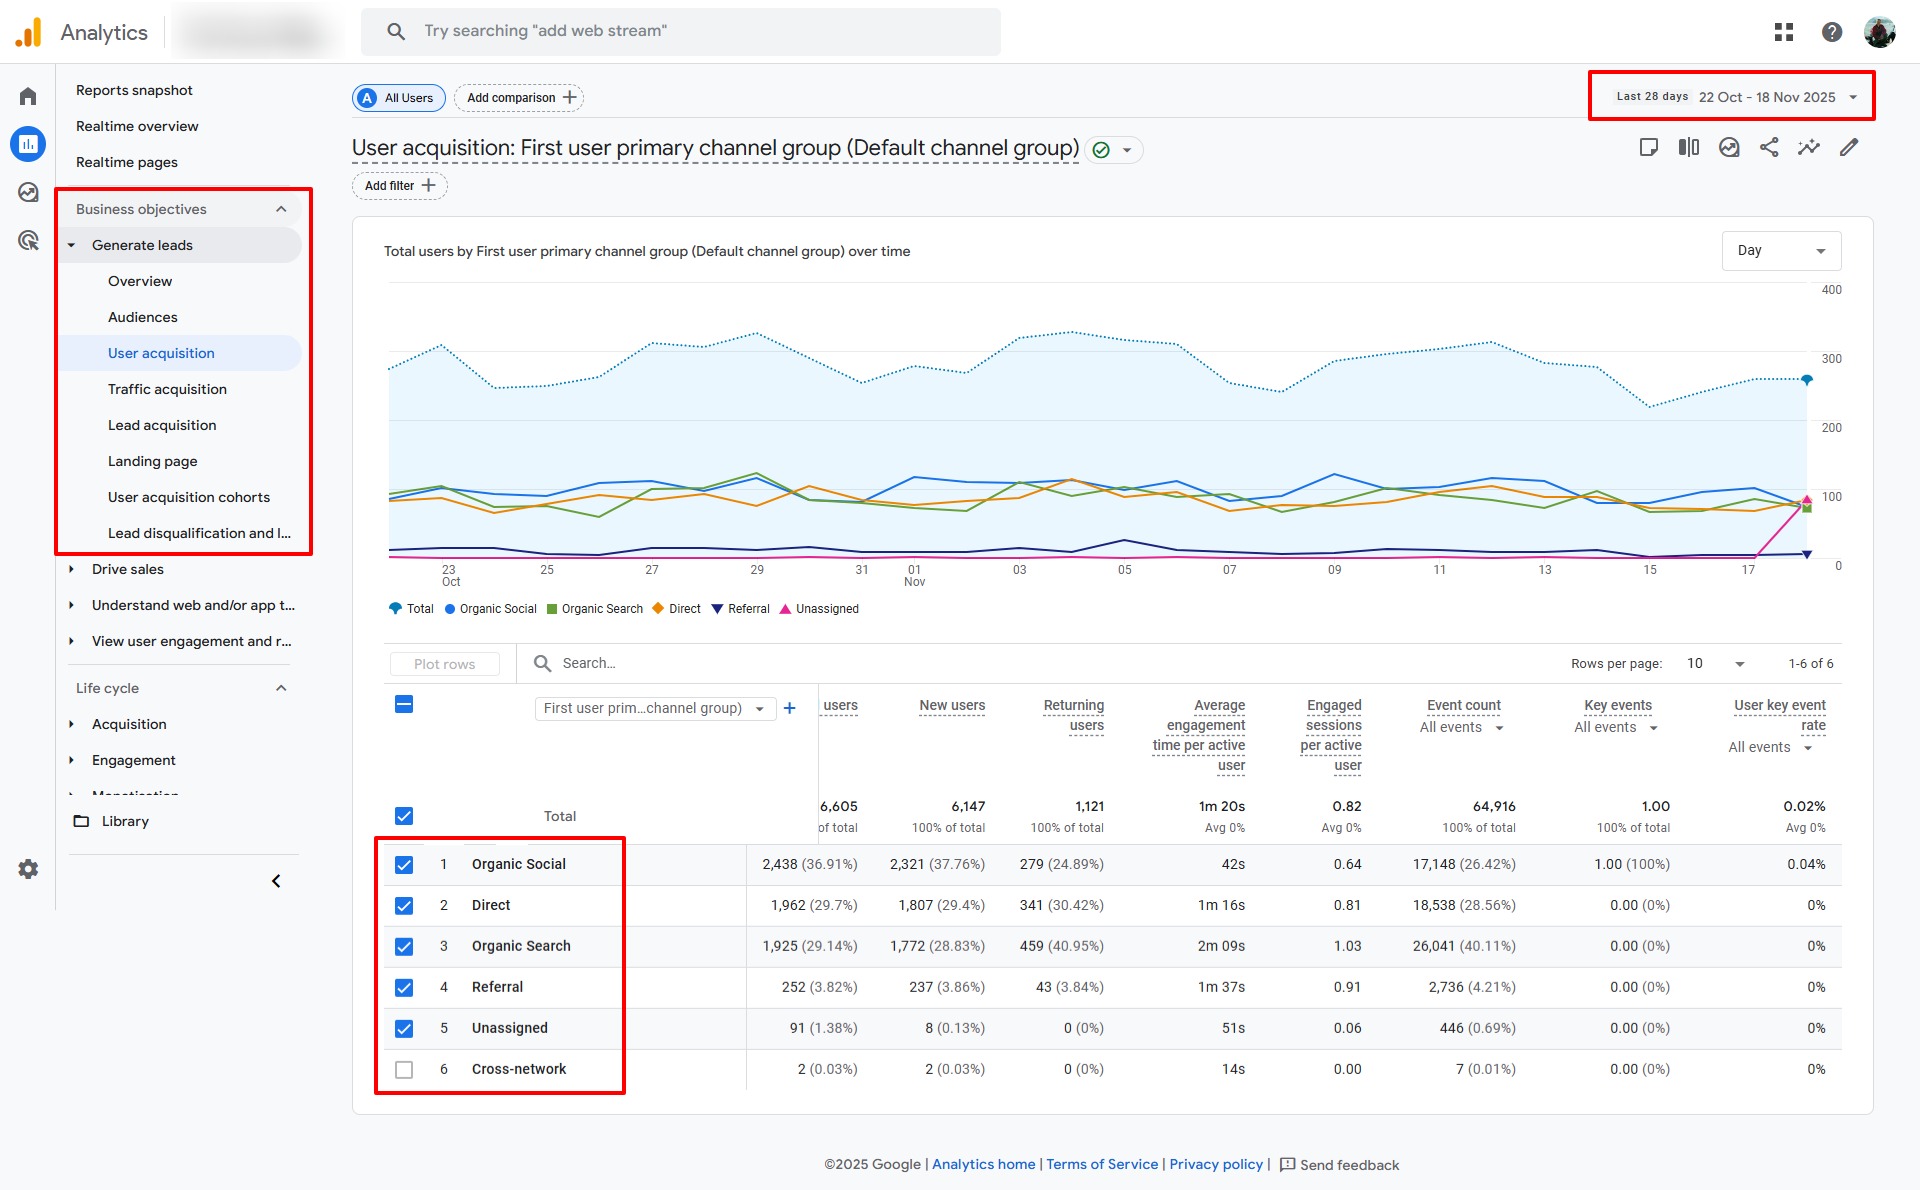
- Business objectives > Generate leads > User acquisition, fig. 2
On the top right you have the date range which can be changed by clicking on the dropdown arrow to its right. In the centre of the page you’ll see a chart of the total number of visitors over the chosen time frame. You can change this view from day to week to month in the dropdown in the top right of the chart. Below that is a table of data including the total number of users, new users and returning users, average time on the site, and event count.
This is hugely valuable. In fig. 1 we can see traffic is very cyclical, by week, with fewer people visiting at weekends vs fig. 2 where traffic is much more consistent.
What are total users?
Total users are defined as ‘the total number of people who visited your site or app in the specified date range’.
What are new users?
New users are defined as ‘the number of people who have never visited your site or app before in the specified date range’.
What are returning users?
And lo and behold, returning users are defind as ‘the number of people who have visited your site or app before in the specified date range’.
What are events?
Events in Google Analytics are essentially interactions people take on your site like a page view, button click, page scroll, video view, add to basket, purchase, download, newsletter signup and so forth.
Some events are created by default but we can also set up custom events. We might also deem some events to be important than others in which case we can mark them as key events (previously conversions in Universal Analytics). Hence, on the right hand side of the table we can sort and select events from the dropdowns.
As we see above, the first website had 92% of traffic from organic search (Google, Bing, Ecosia etc) while this was only 29% for the second site. This is neither good or bad. They are just percentages and are two completely different sites serving two completely different audiences and operating in different fields. Just because one site gets lots of traffic from search engines does not mean the other site is bad. You may operate in an environment where paid ads or social media, for example, might be better suited. Organic social media traffic for the second site on the other hand was much higher at 37% vs nothing at all for the first site. Maybe there’s an opportunity for the first site to be more active on social media!
You can now compare the success of different channels: advertising vs organic search for example. Which channel generated the most traffic? Which generated more sales (purchase key events)? Who stayed on site the longest? Was there a spike from the email campaign you sent recently? What are the implications of doing X, Y and Z?
With this data you can really begin to assess what’s working, understand your marketing efforts, and where you need to put in more or less effort.
Google Analytics Location
Where are people located?
We can also see where your visitors are located.
Go to User > User attributes > Demographic details, fig. 4.
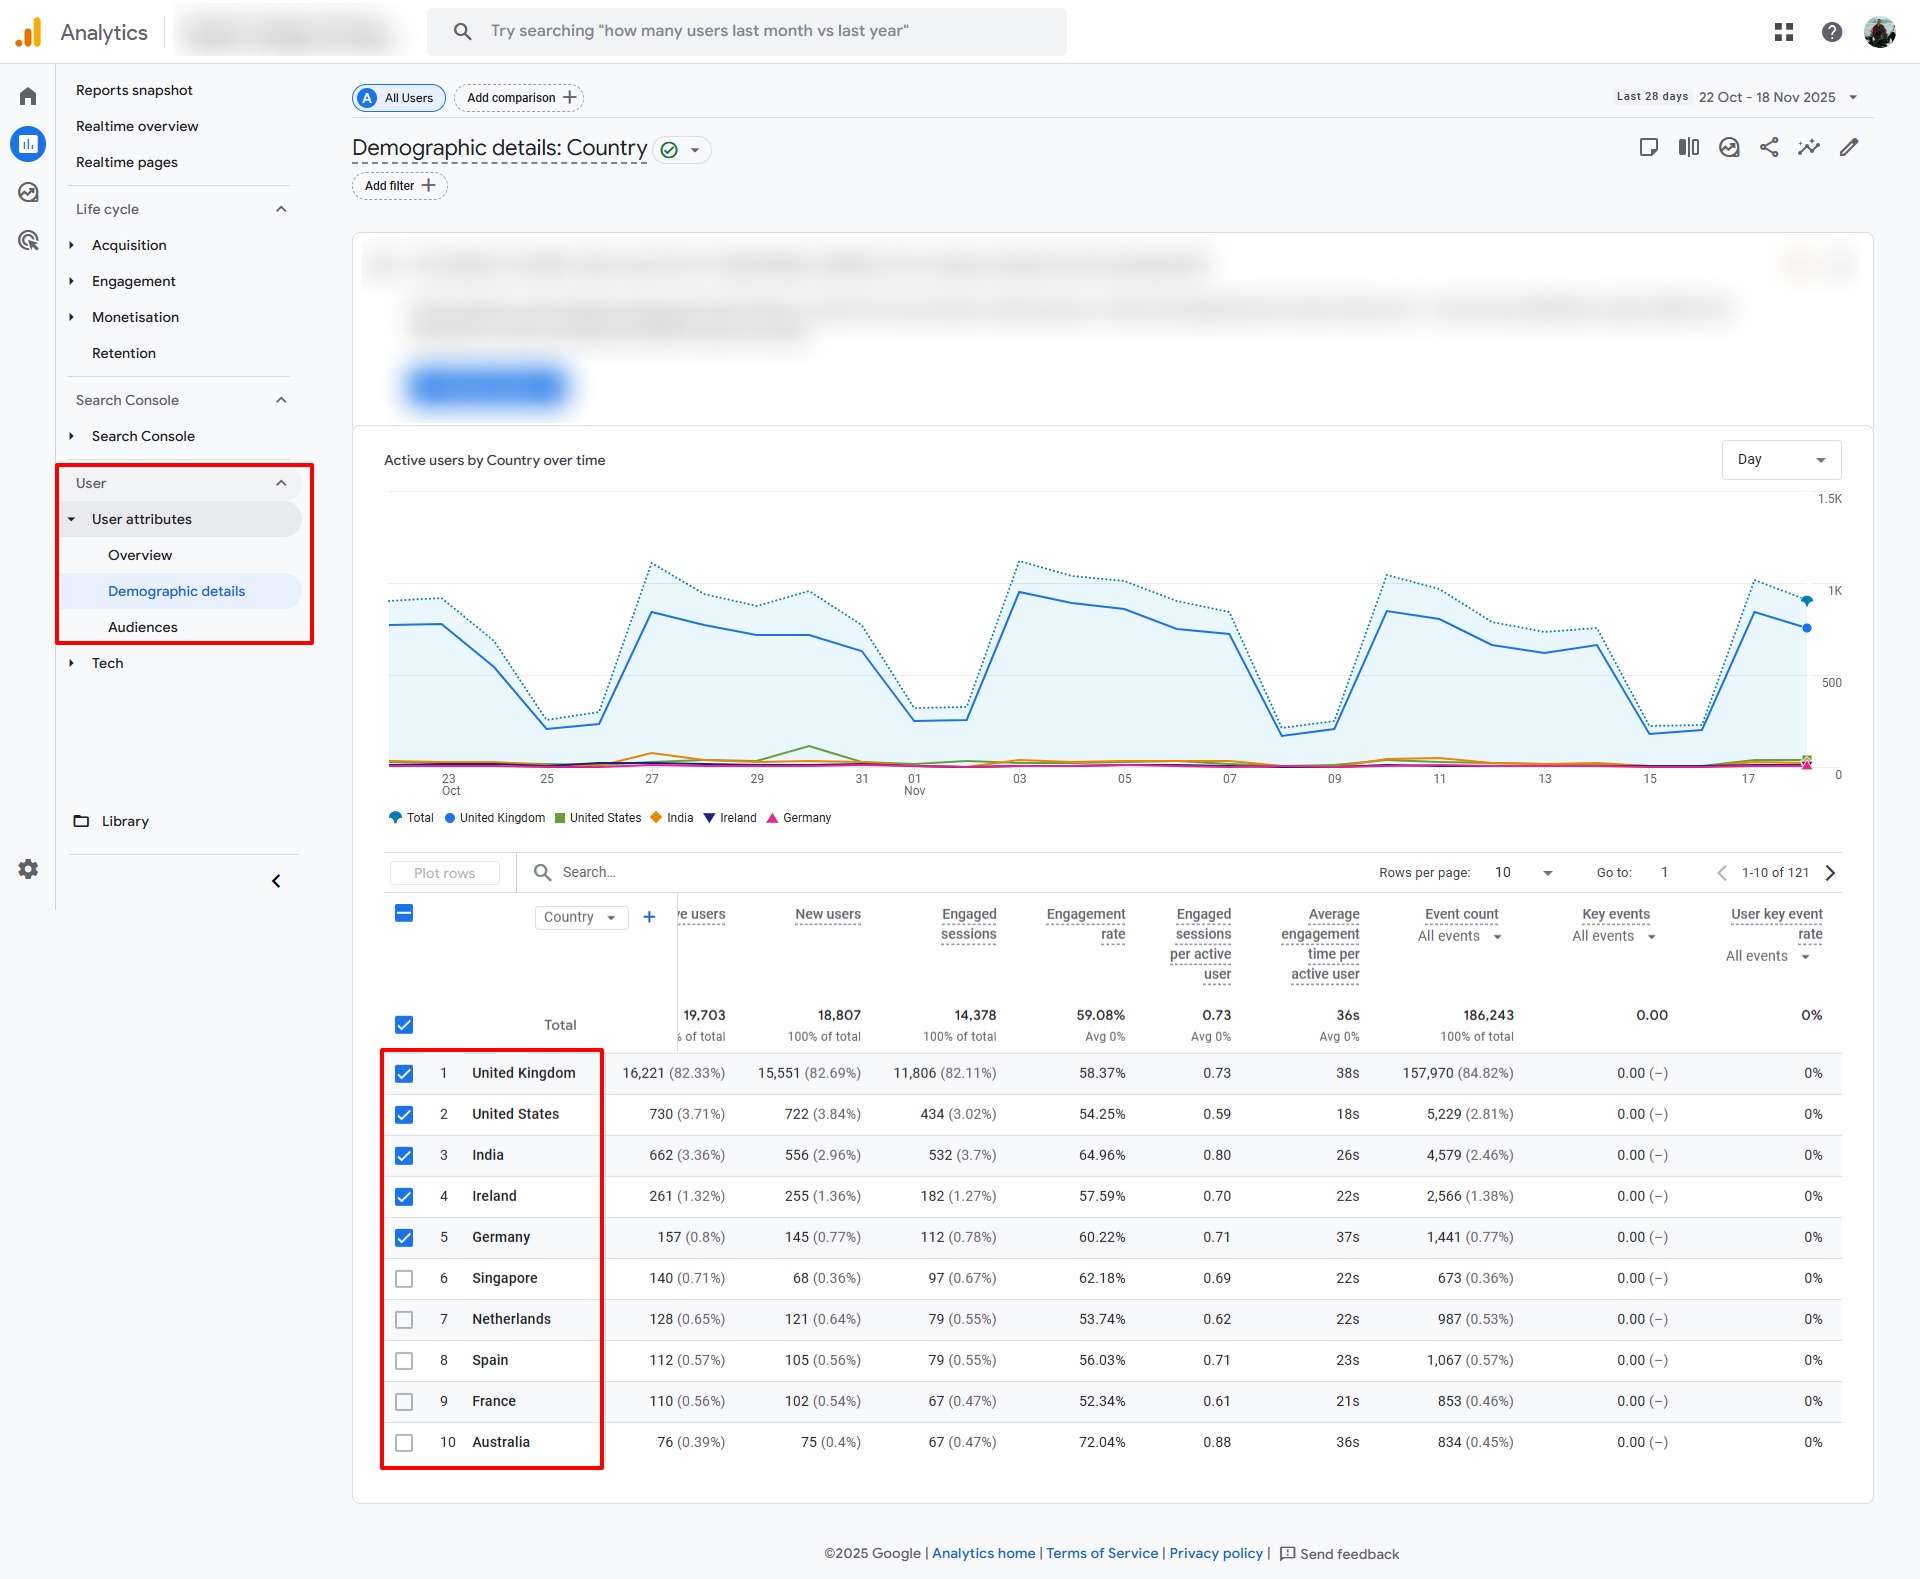
We could also narrow this down by city by clicking on the Country dropdown at the top of the left hand column in the table and choosing Town/City.
But beware! This is dependent on the IP address and results can be misleading.
For example, my office has a dedicated IP address in Cromford, Derbyshire, but at home not far away my IP address is in Oxfordshire, a mere 126 miles away! Depending on your target market you may want to treat Town/City with a degree of caution: it might be fine for B2B businesses with clients in offices which are more likely to have a dedicated IP address but less robust for a travel agent selling summer holidays or a bicylce shop who have a more B2C customer base whose residential IP addresses could literally be miles away, in a different city, county or state!
What Devices Do People Use?
We want a great user experience across all devices (desktop/laptop, tablet and mobile) : fast loading, a great design, engaging, great content, accessible, easy to navigate etc. But how do we find out what devices people are using when they visit our websites?
Go to User > Tech > Tech details > select Platform/Device category from table dropdown, fig. 5.
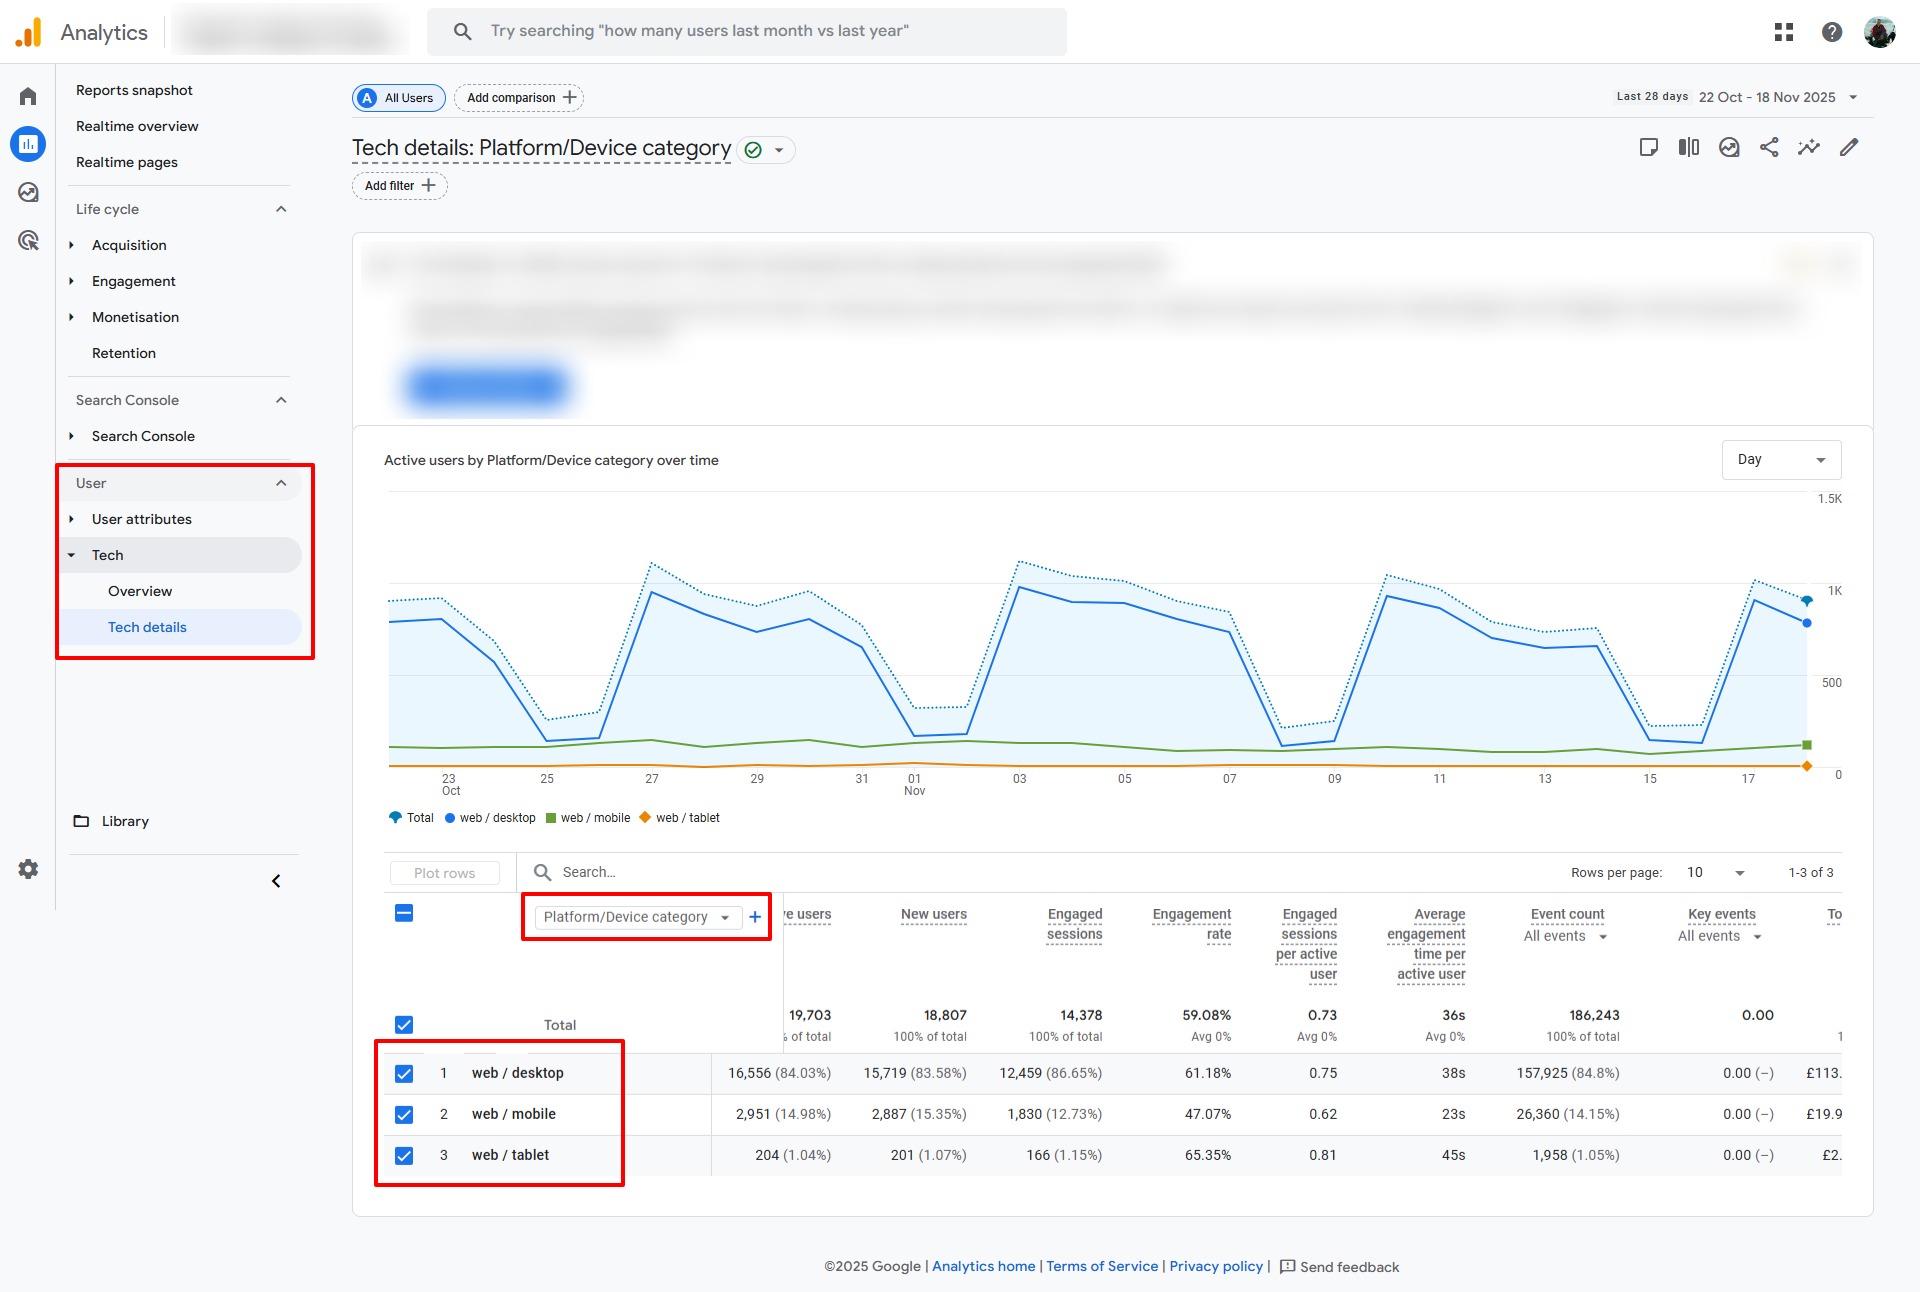
What devices people use may or may not be important to you. Many B2B businesses get more traffic on a desktop or laptop than mobile while the opposite can be true for many B2C businesses. This is absolutely not a hard and fast rule but what device people use really depends on what you’re selling, who your target market is, and how visitors consume your content.
Please do not fall into the trap of thinking more or less visitors on one type of device is better or worse (it might be, but not necessarily). Consider who your target market is, what information they are consuming and whether it is best suited to a desktop, tablet or mobile. What’s good for one business may not be good for another.
For example, if you’re selling highly technical B2B machined products your clients are likely to be in the office and on desktop (they want a large screen and mobiles can be awkward in this instance). But if you’re a supermarket with an ecommerce store your visitors know what a bag of pasta looks like and simply add it to the basket. Job done. They can do it on the bus home.
What we want to strive for though is a good experience across all devices. Being mobile friendly can make a huge difference to how you rank in search engines and rankings can be significantly different across mobile and desktop search results as well.
Google Analytics Engagement
What pages do people view on your website?
Google Analytics also tells us what pages people viewed on your site and how long they stayed on the page. This can help you understand what content is most popular: more popular content will get more views.
But bear in mind that this assumes all content is equally as accessible. If you have a wonderful guide on How to Fix a Broken Thingummy (that’s a technical term!) but it’s buried on page eight of your Resources section, no one’s ever going to find it (unless it popped up in a search result or was posted on social media). If you want your best, most highly prized content to be viewed make sure it’s accessible!
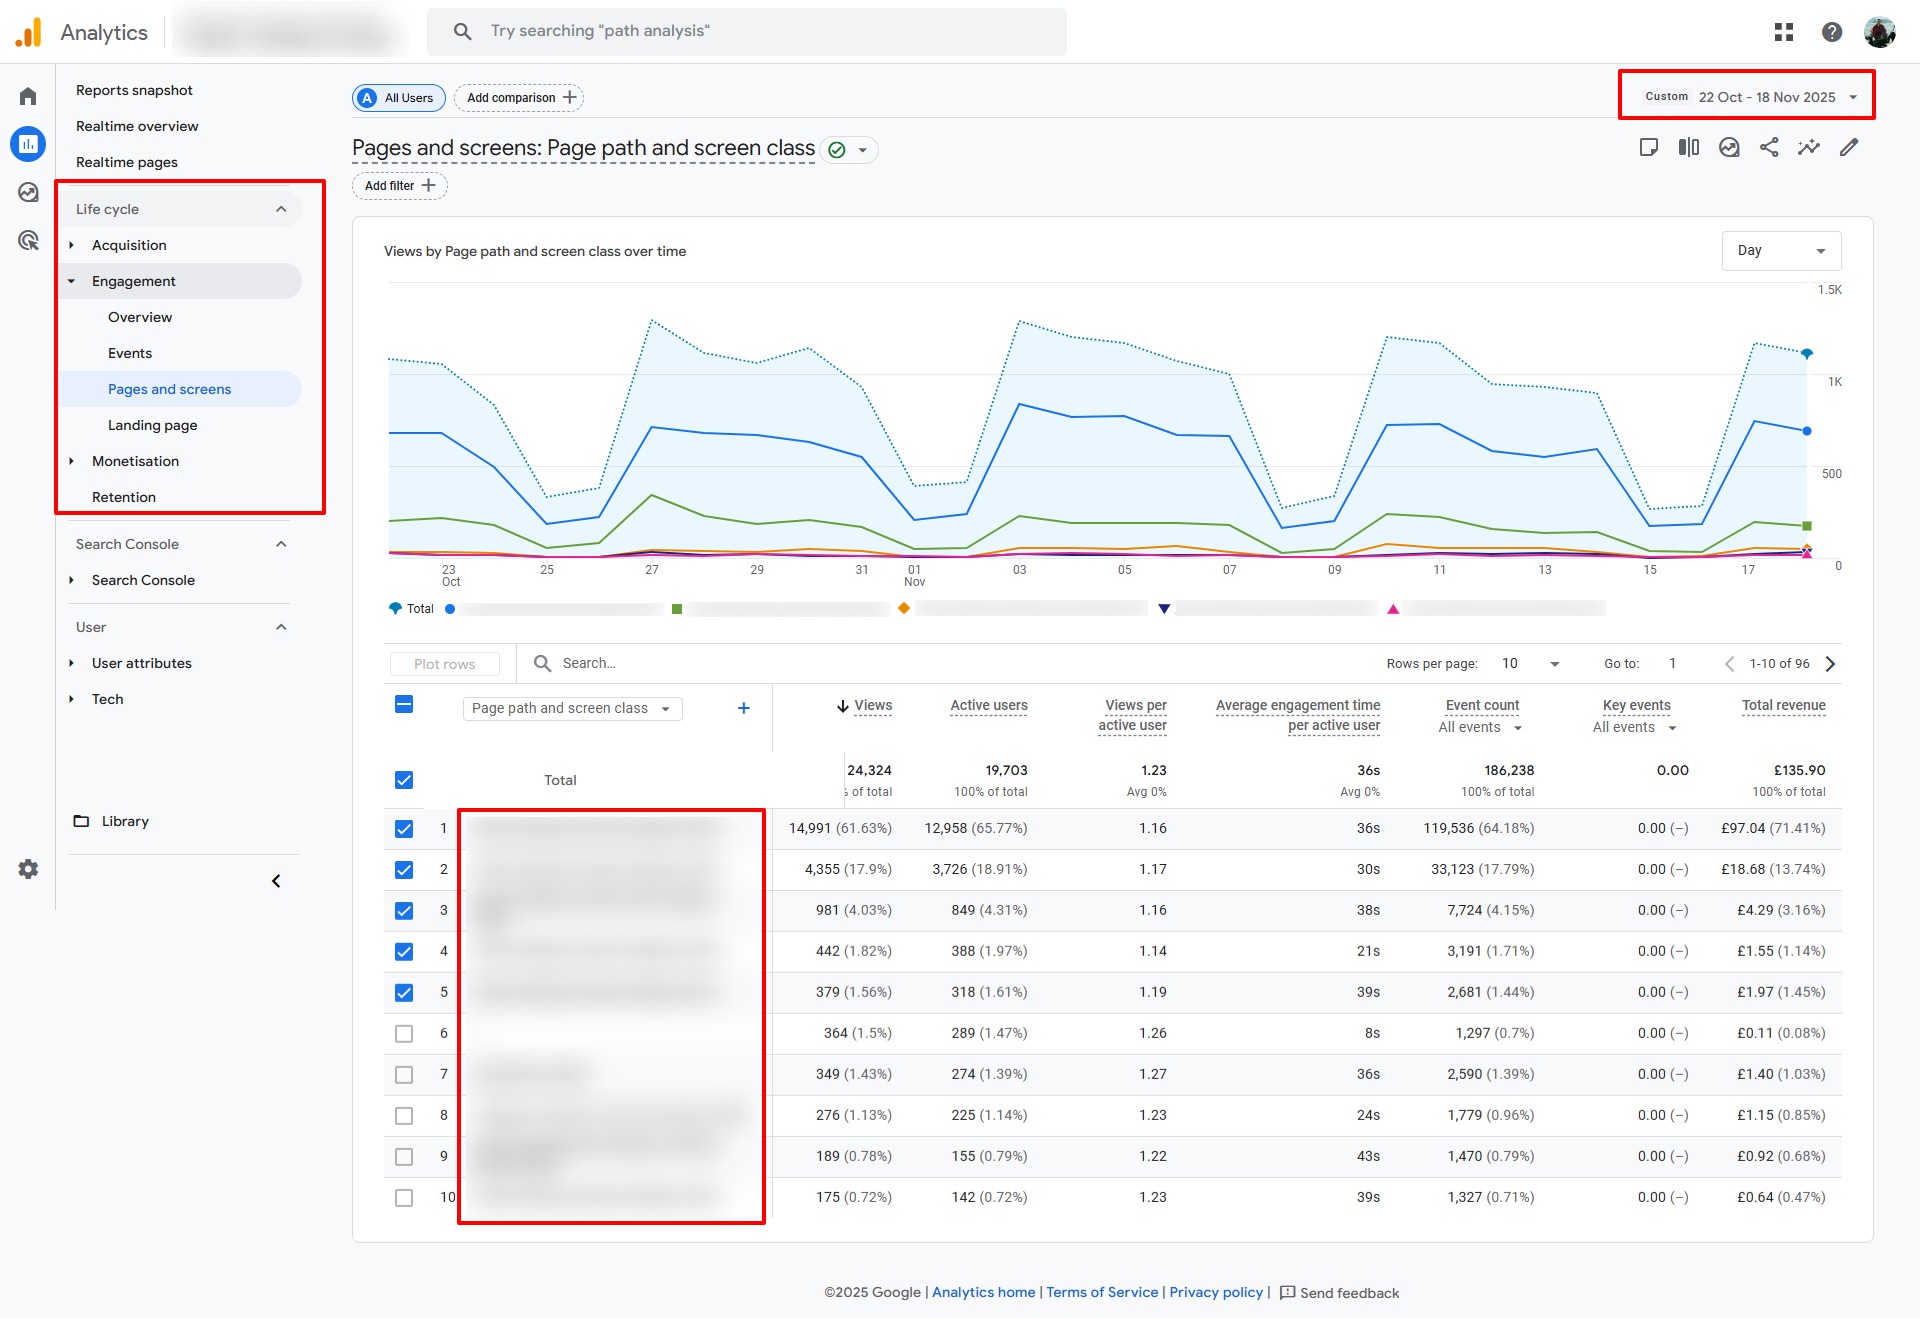
To see your most popular content go to either:
- Life cycle > Engagement > Pages and screens, fig. 6
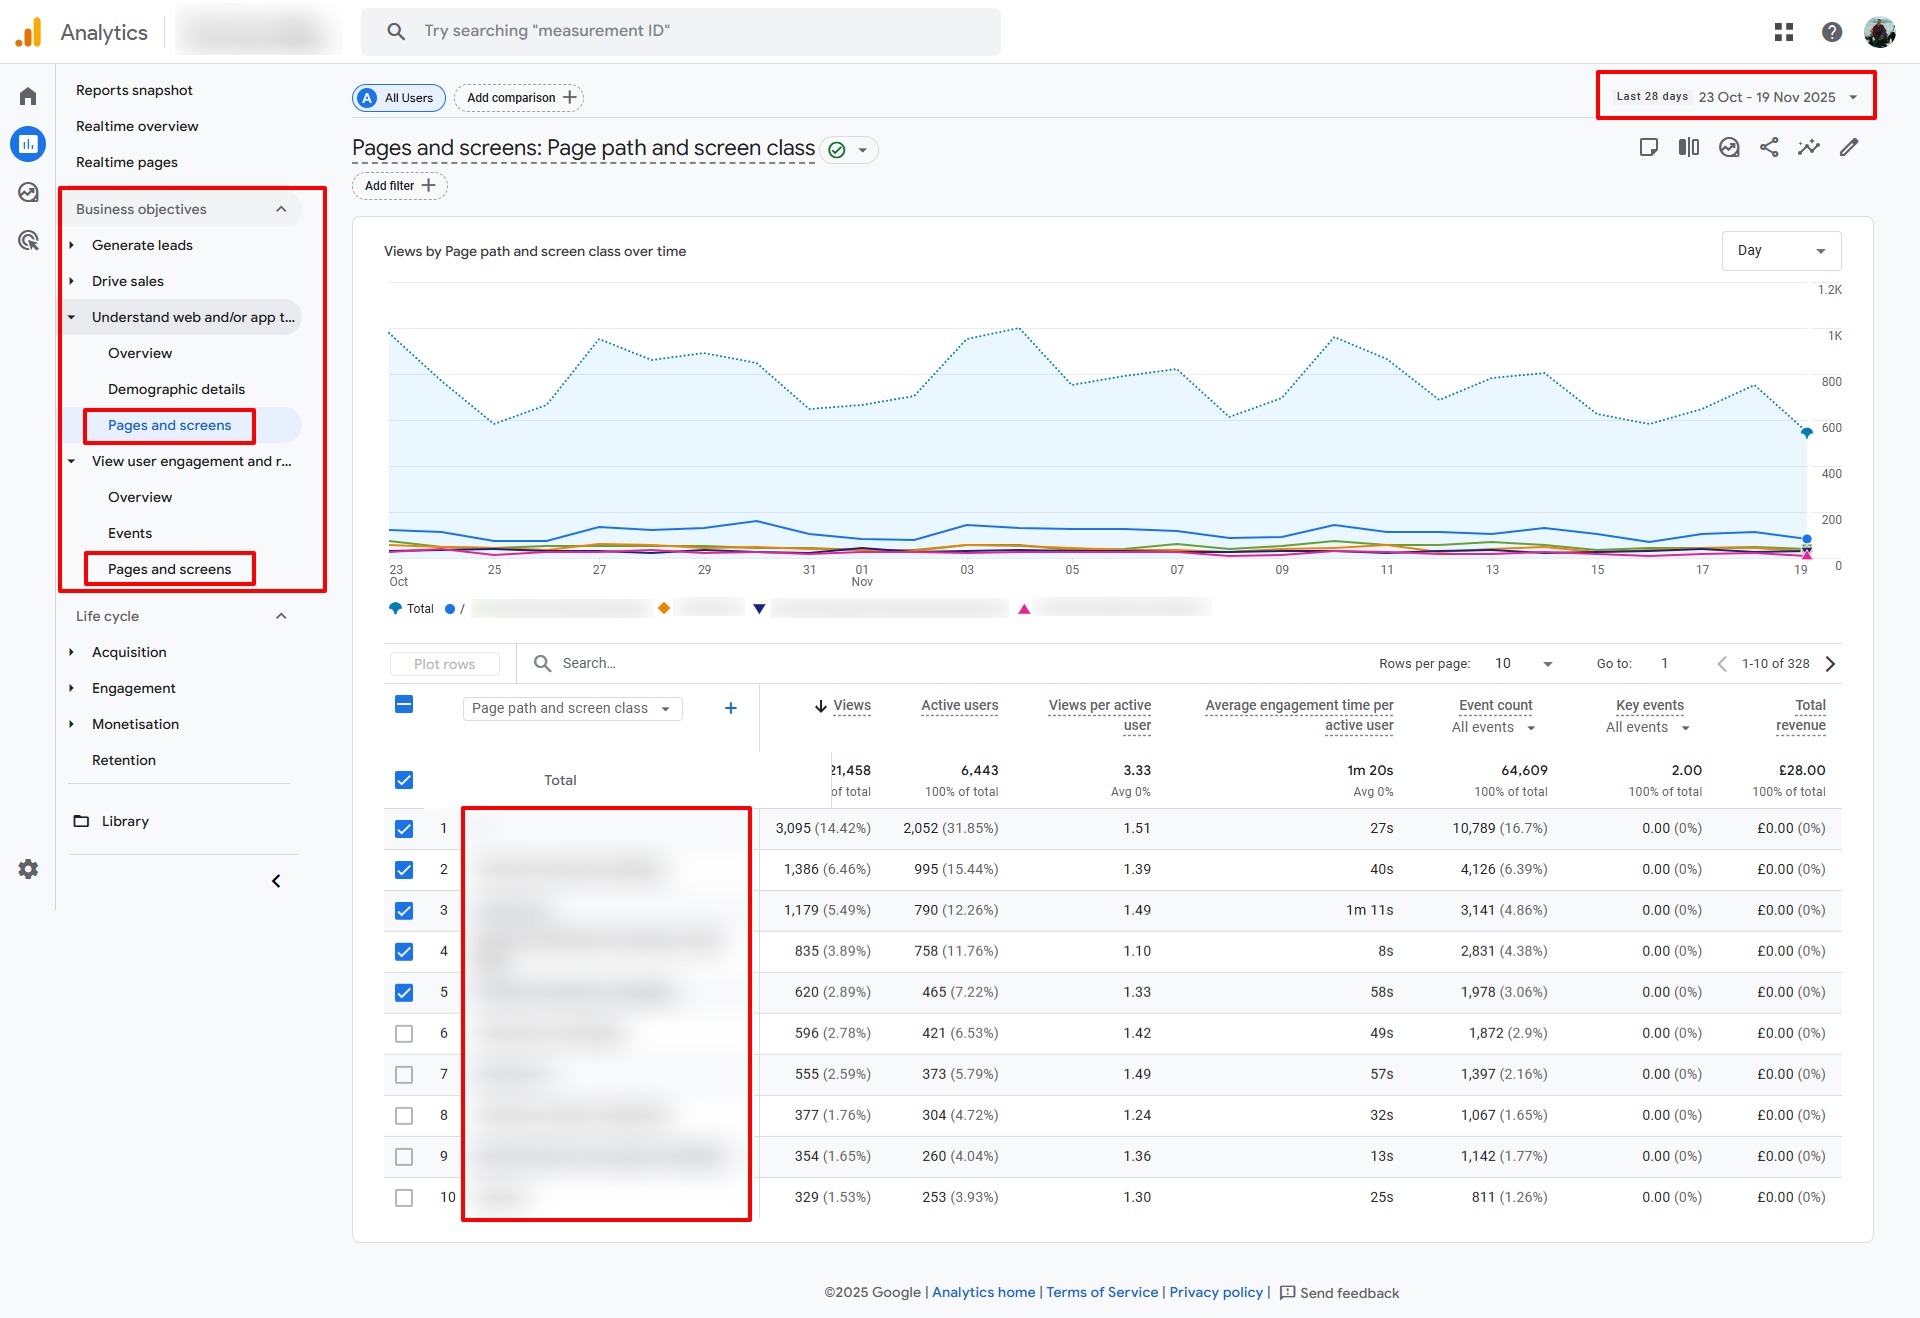
- Business objectives > Understand web and/or app traffic > Pages and screens, fig. 7
- Business objectives > View user engagement and retention > Pages and screens, fig. 7
By default the chart shows Page path and screen class (see dropdown at top of table, first column) but you can change this to Page title if you want.
This will help you understand what people are viewing. Perhaps some products are more popular than others. Does anyone really read you blog? You’re spending a day every week creating content but does anyone actually read it? Do some pages get a lot more views than others? Is anyone viewing your training courses?
Now you know the answer.
Is Your Site Successful? Is it Performing Well?
This is a decision only you can make.
You may be happy with 10,000 visitors per month regardless of where they came from (Google, Bing, Facebook, TikTok, email etc). You may be happy with just 1,000 or terribly disappointed with 100,000 visitors. It really depends what your expectations are, what your business does, makes, sells and offers, what content you have on your website, and how you expect people to interact with it.
If you have an ecommerce site, are all your products on the site? If you sell training courses, are all your courses on the site? How are people expected to sign up: call or book online? If you sell services, are they all there? Are they sufficiently well explained? If you don’t tell people what you do and offer, don’t expect them to know.
A goal could simply be the total number of monthly visitors: you want to drive awareness. There’s nothing wrong with that at all. Or you might want X number of people to download a guide or buy products.
How are you going to achieve that? What’s the plan? Which channel(s) are you going to focus on? Which channel is working? Is that what you expected? Should you be investing more in other channels?
Once you know and understand how many visitors you have on your site and what they do (which pages they view, what products they buy, what content they download), the better position you are in to start adjusting your marketing plan.
What Google Analytics Won’t Tell You
Analytics WILL NOT tell you WHO visited your website: the name, address, email, phone number, business name and so forth. Third party software can provide that. Let us know if you’d like help exploring options.
To obtain such information you typically set up some sort of lead capture if you’re offering a service: Download Our Expert Guide on How to Beat Stress, for example. People enter a name (possibly) and email address in return for the guide. With permission they are then added to your email list where you continue to communicate with them on a regular basis.
If you’ve got an ecommerce site then people generally provide contact details when they make a purchase. (Note: if you sell on Amazon they retain the customer’s information.)
Google Analytics is also not good at telling you keywords (search terms) people used in Google to arrive at your site. To find this out you need to set up another free Google tool called Search Console which will be subject of another post. Bing also has the same tool called Bing Webmaster Tools.
What Google Analytics also CAN’T tell you is anything about your competitors. It cannot tell you:
- How many visitors they get
- How people found their website
- What the most popular pages are
- What search terms were used to find their site
Why? Because a) it’s proprietary information, and b) it relies on adding a piece of code to a website to which only they have access, just like in your case.
Google Analytics isn’t difficult to set up, can be customised to the nth degree, and the data it provides is invaluable. Let us know if you need help setting it up or understanding how it can help you.
Let Us Show You
We can implement Google Analytics for you. Call 0800 6122 937.